





Avoid your inquiry is delay response, please enter your WhatsApp/Skype along with the message, so we can contact you at the very first time.
We will reply you within 24 hours. If for urgent case, please add WhatsApp/WeChat: +86 19966487626,. Or call 400-090-5086 directly.
* We respect your confidentiality and all information are protected. We will only use your information to respond to your inquiry and will never send unsolicited emails or promotional messages.
Why Is My Gearbox Getting Louder? Industrial Transmission Noise Guide | CHIFLY
A practical guide to identifying changes in gearbox noise, vibration, alignment, lubrication and wear.
A gearbox rarely becomes louder for no reason. Something in the transmission system has changed.
That does not mean the gears are automatically damaged. The source may be a bearing, coupling, mounting flange, machine frame, lubricant, load-side component, or even an aggressive servo setting. The useful question is not simply, “How loud is it?” It is this:
Which frequency is increasing, which component is associated with it, and under what speed, load, and temperature conditions does the change appear?
That question turns noise from a complaint into diagnostic evidence.
The same diagnostic logic applies across many precision transmission solutions used in industrial automation. A planetary gearbox, harmonic reducer, or servo gearbox connected to a rack-and-pinion or ball-screw axis can all appear to be the source of the noise, even when the change began elsewhere in the machine.
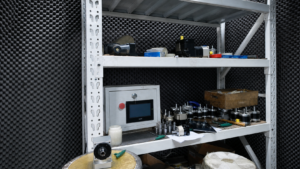
CHIFLY gearbox noise-testing room. Acoustic treatment helps separate product noise from reflections and surrounding factory sound.
Gearbox noise & vibration
Start with the trend, not a single number
A single sound-pressure or vibration reading has limited value without context. A reading of 3 mm/s may be normal for one machine and abnormal for another. A much smaller change can matter if the same machine previously ran steadily at a lower level.
Compare measurements only when the conditions are repeatable:
- Use the same measurement point and sensor direction.
- Record the same speed, load, direction of rotation, and motion profile.
- Separate cold-start data from data taken after thermal stabilization.
- Note whether the increase was sudden or developed over weeks or months.
- Compare idle, no-load, and working-load conditions where the machine permits it.
ISO 20816-3:2022 evaluates industrial machine vibration using both steady-state vibration values and changes in vibration magnitude. It also notes that specific frequency components do not always follow broadband vibration severity. In practice, that means a stable baseline and a growing spectral component may tell you more than one overall RMS value.
Gearbox noise & vibration
Do not blame the gearbox too early
Noise travels through shafts, housings, plates, and machine frames. A relatively small excitation can sound severe after a thin guard, mounting plate, or enclosure amplifies it.
Before treating the gearbox as the confirmed root cause, inspect the complete mechanical path:
- Motor bearings and electromagnetic excitation
- Coupling clamping, key connections, and shrink-disc connections
- Motor-to-gearbox alignment
- Gearbox mounting flange flatness and bolt torque
- Machine-frame stiffness, soft foot, and structural resonance
- Load-side bearings, ball screws, racks, pinions, and linear guides
- Servo acceleration, velocity-loop gain, and oscillation
- Internal gearbox bearings, gears, and lubrication
A gearbox can be the loudest object in the system without being the component that started the problem.
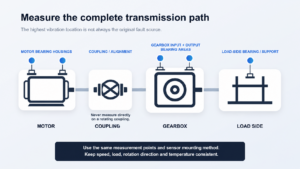
Figure 1. Measure along the complete transmission path before assigning the fault to the loudest component.
Gearbox noise & vibration
Use the sound as a clue, not a verdict
Different sounds can narrow the list of suspects, but sound alone cannot confirm a failure.
| Sound or operating behavior | First areas to investigate |
|---|---|
| Continuous high-pitched whine | Gear mesh excitation, speed-related forcing, alignment, or structural resonance |
| Low-frequency hum | Imbalance, motor electromagnetic excitation, or insufficient base stiffness |
| Repeating tick or knock | Local tooth damage, eccentricity, a loose connection, or a coupling issue |
| Click during reversal | Coupling slip, key or shrink-disc clearance, backlash, or aggressive servo acceleration |
| Rustling, scraping, or grinding | Lubrication loss, contamination, bearing damage, or gear-surface damage |
| Irregular impact | Severe looseness, rolling-element or cage damage, or foreign material |
Temperature, vibration spectrum, lubrication condition, and mechanical inspection must confirm the direction suggested by the sound.
Gearbox noise & vibration
Match the symptom to the operating condition
The moment when the vibration appears often matters as much as its amplitude.
Vibration rises slowly over time
Gradual growth can point toward lubricant deterioration, contamination, gear-surface wear, or bearing fatigue. Review the high-frequency broadband level, envelope spectrum, oil or grease condition, and wear-particle data. A trend that moves steadily away from the machine’s own baseline deserves attention even if it has not crossed a generic alarm value.
Noise appears mainly under load
Suspect tooth-contact problems, shaft deflection, overload, misalignment, or a mounting condition that shifts when torque is applied. Compare the gear mesh frequency and its sidebands at no load and working load. Also record actual torque rather than relying only on the commanded value.
Vibration peaks within a narrow speed range
This pattern often points to resonance. Run the machine slowly through the speed range, where safe, and record both run-up and coast-down data. If the amplitude rises sharply near one speed and falls again above it, inspect the mounting plate, guard, frame, and other flexible structures before assuming tooth damage.
Impact occurs during reversal
Reversal brings every small clearance into the same event. Check coupling clamping, shaft fit, keyways, shrink discs, output connections, gearbox backlash, and the commanded acceleration. Reducing acceleration for a controlled comparison can help separate a mechanical gap from a control-induced impact.
Axial vibration is unusually high
Check angular misalignment, axial preload, thrust loading, and face runout. Strong axial components at one or two times shaft speed often justify a closer alignment and thrust-force review.
Radial vibration is dominated by one-times running speed
Imbalance, eccentricity, and installation runout move higher on the suspect list. Phase measurements, dynamic balancing, radial runout, and concentricity checks can help distinguish them.
Several running-speed harmonics increase together
Mechanical looseness, soft foot, a cracked base, or a distorted flange can produce a series of harmonics rather than one clean peak. Inspect bolt torque, contact surfaces, foundation stiffness, and fit conditions.
Gearbox noise & vibration
Read the frequency before replacing the component
Frequency analysis connects a vibration peak to a rotating part or repeating mechanical event.
The shaft rotational frequency is:
where \(n\) is shaft speed in r/min and \(f_r\) is rotational frequency in Hz.
For a simple gear pair, the gear mesh frequency can be estimated as:
where \(Z\) is the number of teeth on the gear and \(f_r\) is the rotational frequency of that gear’s shaft.
The GMF peak by itself is not a damage certificate. Gearboxes naturally generate mesh frequencies. The pattern around the peak matters. Increasing sidebands spaced at shaft-running frequency may indicate modulation related to eccentricity, misalignment, looseness, or tooth-condition changes. SKF’s official spectrum analysis guide discusses the diagnostic value of GMF sidebands and notes that growing sideband amplitude or count can be associated with gearbox-component problems.
Early bearing and gear defects can produce low-amplitude, repetitive impacts at frequencies higher than the dominant rotational vibration. These signals may disappear beneath the machine’s structural vibration in a conventional overall reading. SKF’s introduction to vibration monitoring explains how envelope or demodulation analysis suppresses lower-frequency rotational content and exposes repetitive bearing and gear-mesh activity.
This is why a broadband value is useful for screening but rarely enough for root-cause diagnosis.

Figure 2. The pattern around gear mesh frequency—and how it changes—often matters more than the peak alone.
Gearbox noise & vibration
A practical on-site diagnostic sequence
1. Decide whether the machine should keep running
Stop the test and follow the machine manufacturer’s safety procedure if you observe a sudden step increase in vibration, metallic impact, grinding, intermittent seizure, rapidly rising temperature, loss of lubrication pressure, severe leakage, smoke, burning odor, or visible looseness or cracking. Do not keep a deteriorating machine in operation simply to collect a cleaner data set.
2. Freeze the test conditions
Record input speed, output load or torque, direction, cold or hot condition, acceleration profile, lubricant type and quantity, recent maintenance, sensor position, sensor direction, and mounting method. Data collected under different conditions cannot form a trustworthy trend.
3. Measure along the complete transmission path
Typical points include the motor drive-end and non-drive-end bearing housings, gearbox input and output bearing areas, housing positions closest to each gear stage, mounting flange, base, and load-side bearing support.
Where access and safety permit, measure horizontal radial, vertical radial, and axial directions. Place the sensor on a rigid surface. A thin guard, label plate, or unstable magnetic surface can distort the result.
4. Measure the overall state first, then locate the source
Use sound-pressure level and vibration velocity RMS to establish the general trend. Add acceleration, displacement, and housing temperature when the application calls for them.
For localization, use FFT spectra, time waveforms, envelope analysis, phase measurements, order tracking during run-up or coast-down, waterfall plots, and lubricant or wear-particle analysis. The right method depends on the symptom. More data is not automatically better if the test conditions keep changing.
5. Build a frequency-to-component map
List the motor speed, input and output shaft frequencies, intermediate-shaft frequencies, tooth counts, GMFs, bearing models and calculated defect frequencies, ball-screw or rack-passing frequencies, and relevant electrical frequencies.
A spectrum without an accurate speed reference shows peaks. It does not reliably identify which shaft or component produced them.
6. Test one hypothesis at a time
If resonance is suspected, perform a controlled speed sweep. If load is suspected, compare no-load and loaded operation. If looseness is suspected, inspect torque marks and fits.
Avoid replacing the bearing and coupling, changing lubricant, reinforcing the base, and retuning the servo in one maintenance window. The noise may disappear, but the root cause will remain unknown.
7. Repeat the measurement after corrective work
Use the same points, directions, speed, load, thermal state, and acquisition settings. Compare overall vibration, key spectral peaks, GMF and sidebands, envelope spectrum, temperature rise, noise, and positioning performance.
Without a controlled before-and-after comparison, “it sounds better” is the only result. That is not enough for a repeatable maintenance decision.
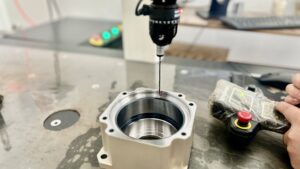
Figure 3. Controlled inspection and repeatable measurement conditions help turn a noise complaint into usable diagnostic evidence.
Gearbox noise & vibration
Four mistakes that waste diagnostic time
Treating dB or mm/s as the complete diagnosis
Overall values can show that the machine has changed. They cannot identify a bearing, gear pair, coupling, or structural mode by themselves.
Adding grease whenever the machine becomes noisy
Too little lubricant can increase friction and wear. Too much can raise churning resistance and temperature, especially when excess grease cannot purge. The wrong consistency, viscosity, additive system, or an incompatible mixture can also create trouble. SKF’s bearing damage and troubleshooting guide lists insufficient, excessive, and incorrect lubricant among possible causes of excessive heat or noise.
Check the specified lubricant, fill quantity, compatibility, purge route, and contamination history before adding more.
Changing several variables at once
This can restore operation, but it destroys the evidence needed to prevent the same failure. Controlled comparisons take longer at the start and save time the next time the symptom appears.
Applying a general ISO limit to every precision gearbox
ISO 20816-9:2020 covers individually housed enclosed gear units from 10 kW to 100 MW and nominal rotational speeds from 30 to 12,000 r/min. Its broadband vibration criteria have limited application to the condition of the gears themselves, while specialist gear-diagnostic techniques sit outside its scope.
A low backlash planetary gearbox, harmonic reducer, or other small precision gear reducer may fall outside that power range or operate under transient duty cycles that differ from the standard’s steady-state basis. Use the manufacturer’s acceptance conditions, a good-unit baseline, historical trends from the same machine, frequency and order changes, temperature, lubricant condition, accuracy data, and physical inspection together.
Gearbox noise & vibration
The data your gearbox supplier actually needs
“The gearbox is noisy” is a starting point, but it is not enough to evaluate the application. Whether an OEM is contacting a planetary gearbox manufacturer or a high precision gear reducer supplier, a useful technical inquiry includes:
- Gearbox model, ratio, orientation, and operating history
- Motor or servo model and control settings relevant to the symptom
- Input speed, output torque or load, duty cycle, and acceleration profile
- The exact point in the cycle when the noise appears
- Cold and hot operating temperatures
- Lubricant type, quantity, relubrication history, and any recent maintenance
- Mounting, coupling, and load-side arrangement
- Audio or video recorded from a fixed position
- Vibration data with measurement point, direction, speed reference, and acquisition settings
- A comparison with earlier data or an identical machine that operates normally
This information helps separate a gearbox-internal problem from installation, lubrication, structural, load-side, or control causes.
Gearbox noise & vibration
The practical conclusion
A louder gearbox is evidence that the transmission system has changed. It is not proof that the gearbox has failed.
Start with a controlled baseline. Identify the frequency that is growing. Connect it to a shaft, gear mesh, bearing, structural mode, or motion event. Then change one variable and measure again.
That is the difference between replacing the loudest component and fixing the actual cause.
CHIFLY engineering note: CHIFLY develops precision transmission solutions and industrial automation transmission components, including planetary gearboxes, harmonic reducers, precision couplings, rack and pinion systems, ball screws, linear guides, and electric cylinders. When requesting application or troubleshooting support, include operating speed, load, duty cycle, temperature, mounting arrangement, lubricant history, and comparable vibration data where available. Specific operating evidence leads to a more useful technical discussion than a sound recording alone.